


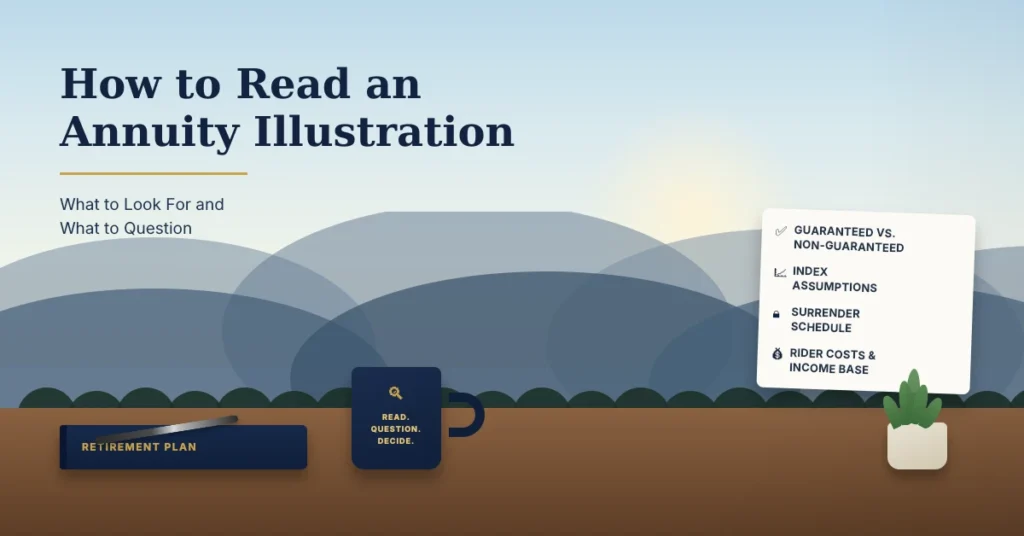
Before you buy an annuity, you’ll usually be handed an illustration: a multi-page document of numbers, columns, and projections. It’s meant to show how the contract could perform, but it’s easy to misread, and the biggest numbers on the page aren’t always the most important ones.
Here’s how to read an annuity illustration, what each section tells you, and which assumptions deserve a second look. It’s a practical companion to our buyer’s checklist.
What an Annuity Illustration Is (and Isn’t)
An illustration is a projection, not a promise. It shows what the contract might do under certain assumptions, usually in two forms:
- Guaranteed values: what the contract is contractually committed to, even in the worst case
- Non-guaranteed (hypothetical) values: what could happen if current rates, caps, and index results hold, or follow a particular scenario
The gap between those two columns is where most misunderstandings begin.
Start With the Guaranteed Column
Before looking at any projection, find the guaranteed values. They tell you the floor: the minimum the contract is committed to provide. Ask:
- What is the guaranteed minimum value after each year?
- How does it compare with what I’m putting in?
- When does the guaranteed value catch up to my premium?
If the guaranteed column looks very different from the projected one, understand why before you decide.
Check the Assumptions Behind the Projections
For fixed indexed annuities, projected values depend on assumptions you should be able to identify:
- Index performance used. Is the illustration using a historical period, an average, or a specific scenario? Illustrations that use a favorable past period show what might have happened, not what will.
- Cap rates, participation rates, and spreads. These are often the current ones, and carriers can usually change them over time within contract limits.
- Crediting method. Annual point-to-point, monthly average, and others can produce very different results from the same index.
A projection that looks impressive may depend on assumptions that are optimistic or can change. We cover how crediting works in How Annuities Grow Tax-Deferred.

Find the Surrender Schedule
Somewhere in the illustration, you’ll see the surrender charges by year. Check:
- How many years the surrender period lasts
- What the charge is in each year
- How much you can withdraw each year without a charge
The “surrender value” column, which is the amount you’d receive if you cashed out, is often much more informative than the headline account value.
Look for Rider Costs and the Income Base
f the contract includes an income rider, the illustration should show how the guaranteed income is calculated.
- The income base is not cash. It’s a formula-driven number used to calculate lifetime income, not an amount you can withdraw.
- Riders usually carry an annual fee, and the illustration should show how it affects the account value.
- Income depends on when you start. The payout percentage generally changes with your age at activation.
Our comparison, Income Annuity vs. Income Rider, explains how these pieces fit together.
Review the Death Benefit and Other Provisions
Look for what the contract pays beneficiaries, any free-withdrawal provisions, and any waivers for situations like nursing home confinement, which can vary by contract.
An Illustration Reading Checklist
| What to Find | What to Ask |
|---|---|
| Guaranteed values | What is the worst-case outcome, and when does the guarantee exceed my premium? |
| Non-guaranteed values | What assumptions produce these numbers, and can they change? |
| Index assumptions | Is this a past period, an average, or a specific scenario? |
| Surrender schedule | What would I receive if I needed the money in year 2, 5, or 8? |
| Rider costs | What does the rider cost each year, and how is income calculated? |
| Carrier | How strong is the issuing company’s financial rating? |
Red Flags to Watch For
- Only the best-case column is highlighted
- The illustration isn’t personalized to your age, amount, and goals
- Pressure to decide before you’ve had time to review it
- Reluctance to explain an assumption in plain language
Take It Step by Step
A good illustration should make a contract clearer, not more confusing. If any part of it doesn’t make sense, that’s a reason to ask questions, not to sign. This is the same approach behind the three goals we describe in Protection, Accumulation, and Income: know what each product is meant to do, and what it costs you.
This article is for general educational purposes and is not tax, legal, or investment advice. Illustrations are projections and are not guarantees. Guarantees are backed by the claims-paying ability of the issuing insurance company. PAG Advisory Group specializes in insurance-based retirement strategies and does not offer securities.
Holding an illustration and not sure what it’s telling you? Schedule a free retirement review and we’ll walk through it with you, line by line.